Help
OKR Dashboard view
View your OKR Dashboard.
OKR Dashboard
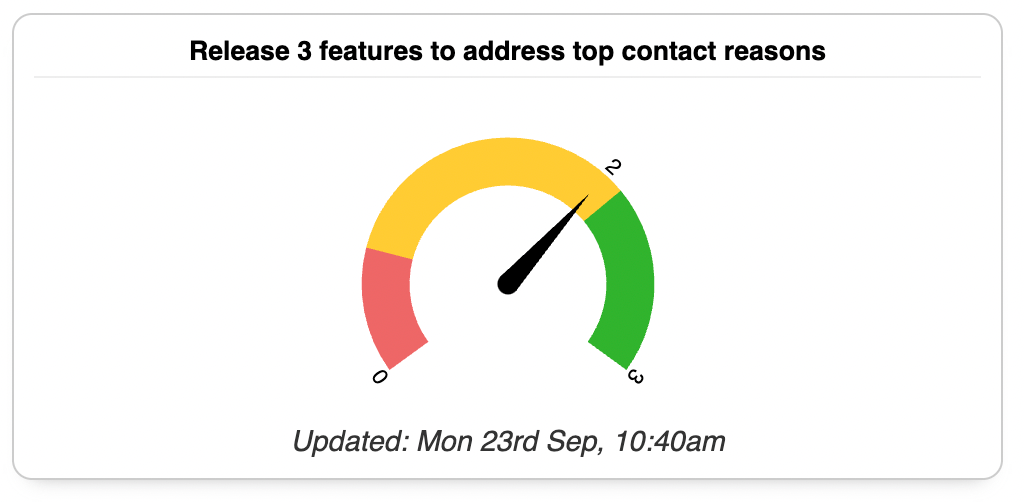
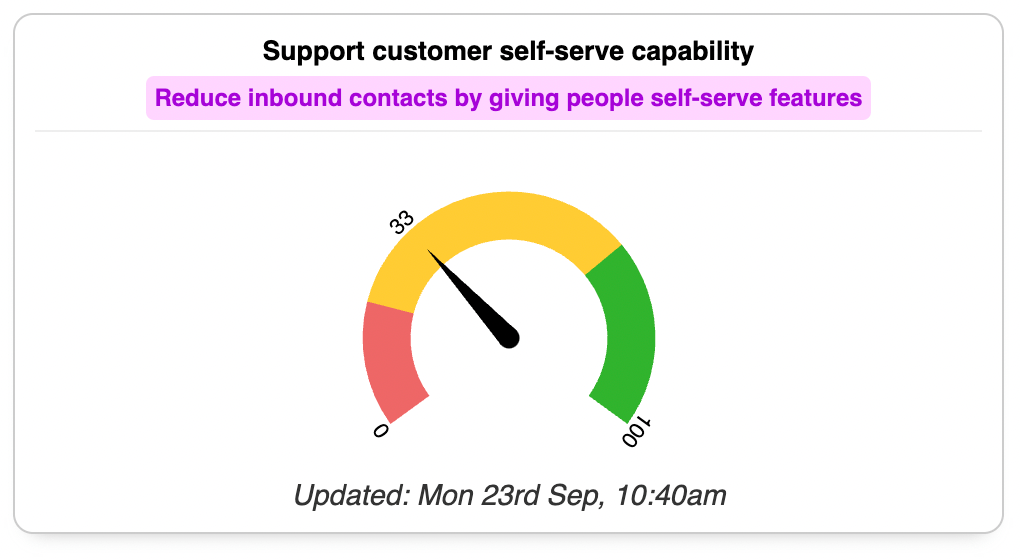
Our Dashboard view presents a "big screen" view of your OKRs and their current state, useful for putting up on a TV or monitor in your office or at home, or for stakeholder presentations.
It shows different widgets depending on the Key Result type:
-
Numeric KRs: show as a simple gauge highlighting the current value against the start and target values. The first 20% is coloured red, and anything above 70% is coloured green since 0.7 is the normal target threshold for KRs.

-
Cascade KRs: similar to Numeric, this widget shows the overall progress of the child Objective and also highlights the name of the child Objective so you know where the progress is being pulled from.

-
Milestone KRs: milestones are either "done" or "not done" so this widget shows a tick or a cross.

-
Delivery KRs: shows a thumbs up or down depending on whether the delivery is on track / delivered, or off track / delivered late.

Customising the view
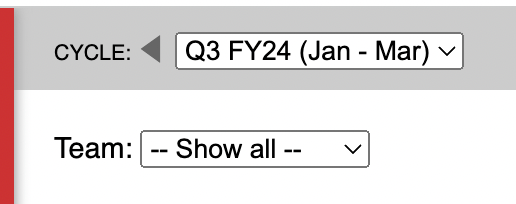
The Dashboard is automatically filtered to the current Cycle, and the Cycle selector is shown at the top of the page so you can move backwards and forwards between time periods to see the one that's relevant.
Since you may have a lot of OKRs you can also filter to a specific Team by using the drop down selector at the top of the page.
